Archive
Investigating Deep Brain Stimulation (Continued)
So the second thing the researches wanted to test was whether the electrical stimulation was stimulating glial cells to secrete inhibitory chemicals. To do this they introduced channel rhodopsin (this protein activates cells wheras the halorhodopsin inhibits them) using viruses but put it under a glia-specific promoter so instead of excitatory cells expressing the protein it was the surrounding glial cells. Here are the results:

Protein was expressed in the proper cells. Activation of glial cells caused a reduction in firing rate
With all studies like this the researchers must include histological verification that the proteins they’re trying to express are, indeed, being expressed, and in the right places. Here we see a stain for GFAP (a glial-specific protein) in green and the channel rhdopsin in red. In the overlay it is clear that there is strong colocalization. In short, the protein is where it should be. It’s very important to check but fairly repetitive and uninteresting so I’ll neglect it in the next few figures.
The proteins are activating proteins so you might expect to see an increase in spiking, but… we don’t. We don’t because the cells creating those large spikes are the neurons, and the neurons were not being activated by the light. Instead the light was activating the glia which secreted chemicals that inhibited the surrounding neurons resulting in an overall decrease in firing.
This treatment had no effect on parkinson’s symptoms.
The researchers found that causing the excitatory cells in the STN to fire at normal rhythms (by supplying light pulses to transfected cells at those normal rhythms) also had no therapeutic effect.
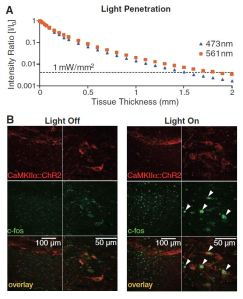
At this point the researchers take a moment to prove that the light they’re supplying is really hitting the places they think it is. They take small samples of brain tissue and simply shine their lasers through it, measuring the intensity at various distances. The light-activated proteins being used require a light intensity of about one mW/ square mm.
The top graph shows that the two colors of light being used each are sufficiently intense after passing through up to 1.5 mm of tissue. Below shows what cells have been activated by the light. Neurons produce the protein c-fos when they are activated which can later be stained for. By measuring how far from the epicenter of the light application c-fos appears the researchers can determine what volume of tissue could have its light-sensitive proteins activated. It turned out that about 1 cubic millimeter of tissue received bright enough light. The viral injections that introduce the DNA for these proteins affect about one cubic millimeter, so any infected cell can be successfully activated by this light application technique.
Up next: an optogenetic interference that had therapeutic effect. Stay tuned!
Investigating Deep Brain Stimulation
This past winter semester I took a class about recent studies into complex behavior. The majority of the papers we read were about fruit flies’ mating habits and other model organisms, investigating the very basics of how flies decide who to mate with, for example. The last portion of the class we individually prepared presentations about papers often having to to with mammals and less fundamental research. I thought I’d share my presentation on a paper ( Gradinaru et al. 2009) whose goal was using optogenetics to determine why deep brain stimulation (DBS) actually works. So DBS stimulation, in essence, involves sticking an electrode down into the brain to the subthalamic nucleus (STN), a part of the brain involved in motor control. The electrode injects current at a high frequency and this often eliminates Parkinson’s symptoms, but nobody knows why.

An electrode is inserted from the top of the brain down to the Subthalamic Nucleus. Power is supplied from a little pack by the collarbone.
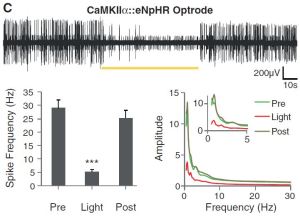
Electrical stimulation affects all cells nearby, be they neuron bodies or glial cells or even axons passing near the electrode, so even though it is known where DBS occurs it’s harder to say which cells being affected by DBS are having a therapeutic effect. The leading hypotheses regarding the are that excitatory cells in the STN are inhibited by the electric stimulation, that astroglia (nearby support cells) are activated and secrete a chemical which inhibits excitatory cells in the STN, and that the cells of the STN are firing in the wrong pattern. To attempt to tease these different possibilities apart from one another the investigators used optogenetics in hemiparkinsonian rats. So firstly, hemiparkinsonian rats are rats that have half (hemi) Parkinson’s, which is achieved by applying a chemical to one side of their brains’ motor circuit, causing a lesion which leads to Parkinson’s symptoms only in one direction. One result of this is that the rats “rotate” or walk in circles sometimes. DBS can be given to these rats which eliminates their rotations and other Parkinson’s symptoms. Optogenetics is the introduction of light sensitive ion channels/pumps into cells using (in this case) viruses. The damaging parts of the viral DNA are removed and replaced with genes coding for these light-sensitive proteins and these genes are under the control of DNA regulatory elements called promoters which are only activated in certain cell types. The result is that you can inject a small amount of these viruses into an area that you’d like to stimulate, the viruses insert the DNA into all the cell bodies around that area (the viruses don’t tend to inject into axons passing through), but only cells capable of driving the promoter (cells that produce the necessary transcription factors) that has been injected will actually make the protein. The protein produced will find its way to the cell membrane where it is ready to activate or deactivate that cell upon application of light of the appropriate wavelength (color). I’ll go over one figure now and leave the rest for later. Here are the results from Figure 1: 
- Light application did reduce firing rate
CaMKIIα::eNpHR refers to the viral DNA setup used. It was Halorhodopsin (eNpHR) under the calmodulin-dependent kinase type II promoter (found specifically in excitatory cells (those that use glutamate as their neurotransmitter)). The black band across the middle is an electrical recording of the area being stimulated with light. Voltage is on the Y axis, time on the X. The yellow bar shows when yellow light is applied (halorhodopsin is most sensitive to yellow light). The graphs at the bottom show the same thing.
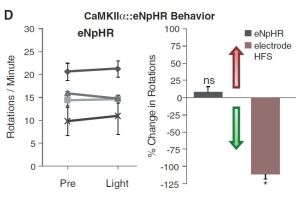
The chart on the left and the black bar in the right shows that the rotations were unaffected by the light. The red bar shows that electrical stimulation (DBS) was indeed effective (as was known and expected).
The conclusion from this is that deep brain stimulation is not effective (at least solely) because it inhibits the activity of excitatory neurons in the STN.

